
Case Study / Agentic AI · Quick Service Restaurants
Conversational workforce analytics for a Singapore restaurant chain
Algorims built an AWS platform that lets managers ask staffing questions in plain English. Delivered in four weeks, it analysed 490K+ transactions and uncovered a 46% productivity gap.
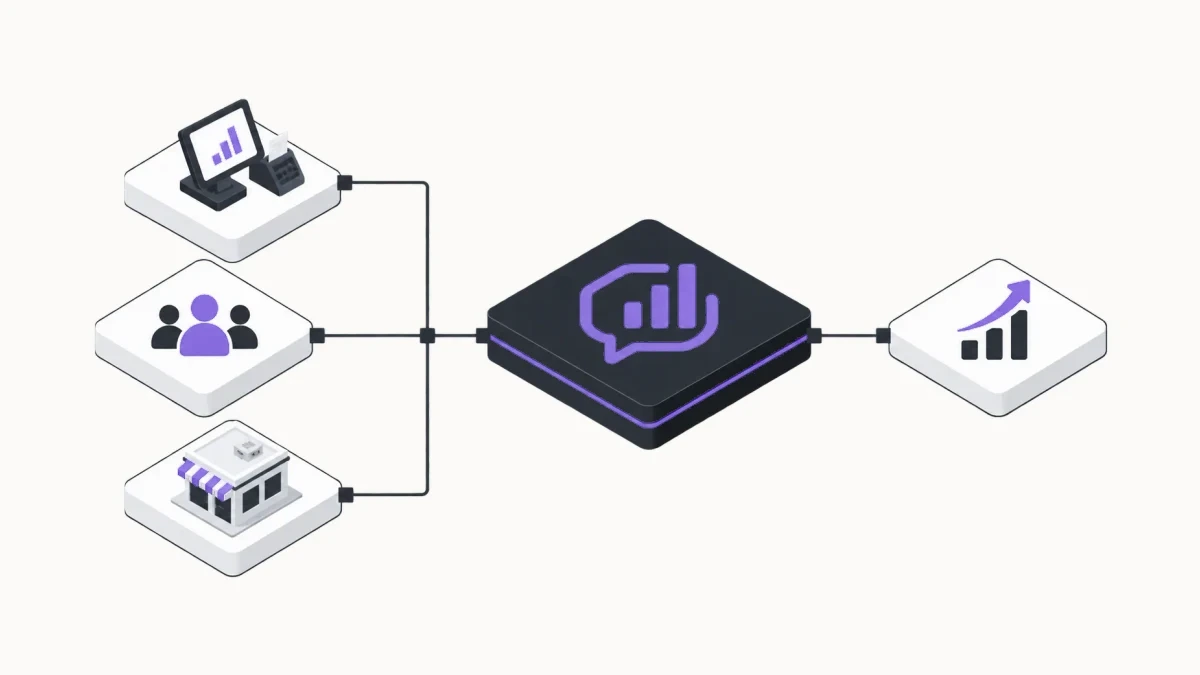
- Industry
- Food & Beverage · QSR
- Region
- Singapore
- Engagement
- 4 weeks to production
- Platform
- Serverless AWS + Amazon Q
Measured impact
Transactions processed across 13 months of data
Hidden productivity gap uncovered between time periods
From architecture to production deployment
Plain-English analytics via Amazon Q — no SQL, no analysts
Fully serverless AWS architecture — scalable by design
Data access democratised across the whole business
01 / Overview
The operating context.
A leading QSR operator managing multiple outlets across Singapore was making critical workforce decisions in the dark. Labour analytics relied entirely on manual reporting and fragmented data sources, leaving managers unable to answer the questions that mattered most.
The answer wasn't more reports. It was real-time, AI-powered intelligence that anyone in the business could access — instantly, in plain English, without needing a data analyst.
02 / Challenge
What stood in the way.
Workforce decisions were being made without the data to support them — and the existing reporting stack couldn't close the gap:
- 01
Labour analytics relied entirely on manual reporting and fragmented, disconnected data sources.
- 02
Managers couldn't see which time periods were genuinely productive versus loss-making.
- 03
Overstaffing and understaffing went undetected across outlets until after the fact.
- 04
There was no visibility into how labour cost was impacting outlet-level performance.
03 / Solution
What Algorims built
A Conversational Analytics Platform on AWS — a fully serverless, cloud-native intelligence system that transforms raw operational data into actionable insights through natural language, engineered across six layers.
Data ingestion & storage
Raw labour and transaction data ingested and structured in Amazon S3 — creating a single, reliable source of truth across all outlets.
Data engineering pipeline
AWS Glue crawlers and ETL processes clean, transform, and optimise raw data for high-speed analytical querying at enterprise scale.
Analytics layer
Amazon Athena computes critical business KPIs — TCPMH (transactions per crew man-hour), SPMH (sales per man-hour), and labour cost % — all validated against real business logic.
AI-powered natural language interface
Amazon Q lets business users ask workforce questions in plain English and instantly receive AI-generated charts, insights, and contextual follow-up recommendations. No SQL, no analysts, no waiting.
Real-time dashboards
AWS QuickSight delivers interactive, real-time visualisations — KPI monitoring across time periods, zones, and operational areas — giving every manager complete visibility at a glance.
Enterprise security & governance
Full encryption, IAM role-based access control, and comprehensive audit logging — built in from day one, not retrofitted after launch.
04 / Architecture
The system behind the outcome.
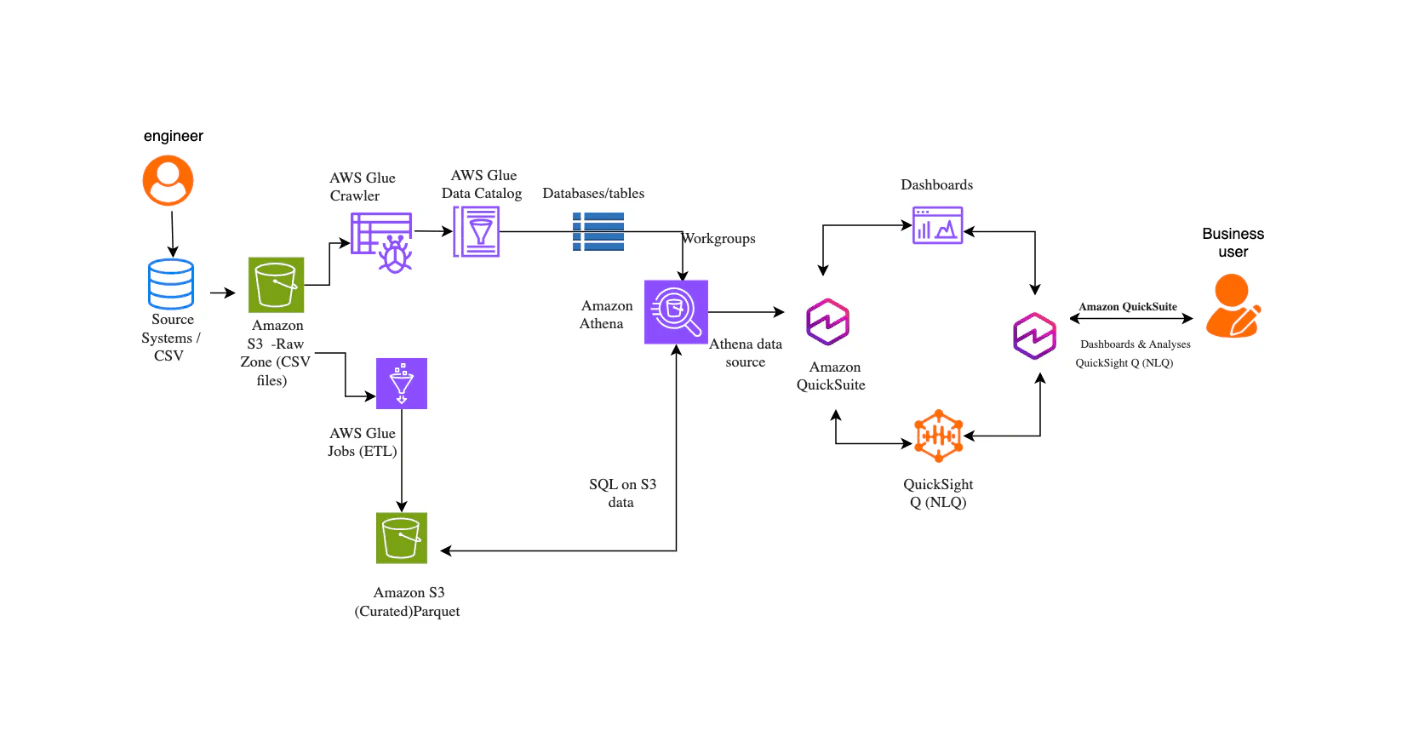
Raw labour and transaction data flows from source systems into Amazon S3, is catalogued and transformed by AWS Glue, queried through Amazon Athena, and surfaced to business users through Amazon Q natural-language queries and QuickSight dashboards.
System stack
Production foundations.
- Amazon S3
- AWS Glue
- Amazon Athena
- Amazon Q
- AWS QuickSight
- AWS IAM
- AWS KMS
05 / Results
What changed after delivery.
Instant decision-making — real-time workforce insights through natural language; decisions that took days now happen in seconds.
490K+ transactions across 13 months of operational data processed with complete visibility.
A previously invisible 46% productivity gap between time periods uncovered — enabling targeted optimisation.
4 weeks from architecture to production — faster than any traditional analytics programme.
Managers now make proactive staffing decisions driven by AI, controlling labour cost across every outlet.
Data access democratised — non-technical users interrogate operational data freely, no SQL required.